Working with Excel data
Ten minutes. Every previous tutorial moved single values around. Real business automation moves tables, and a spreadsheet is where most of them live. Four nodes is all it takes to get one into a flow.
What you need
- Tutorial 5 finished
- Any
.xlsxfile with a header row and a few rows of data
You do not need Microsoft Excel installed. The Excel package
reads and writes .xlsx files directly, on Windows, macOS and Linux alike.
There are two packages with similar names and they are not interchangeable.
Excel is the one to reach for. It reads the file format itself, so a flow built with it runs on any robot.
Microsoft Excel drives the real desktop application through COM. That ties the flow to a Windows machine with Office installed, so keep it for the two jobs nothing else can do: very large workbooks and running macros.
The flow you are building

Build it
-
Create a project named
Read an Excel File. -
Add a Inject node (Trigger → Inject) and rename it
Start. -
Add Open Excel (Excel → Open Excel) and connect
Startinto it. Set: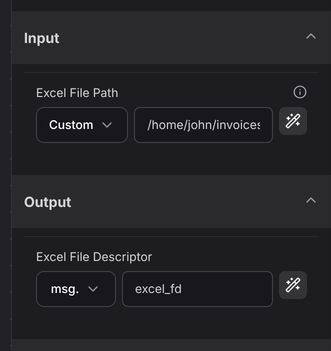
Property Value Excel File Path Custom → the full path to your file Excel File Descriptor Message → excel_fdThe file descriptor is the important output. Opening a workbook does not put its contents in the message — it puts a handle there, and every other Excel node takes that handle to say which open workbook it means.
-
Add Get Range (Excel → Get Range) after it:
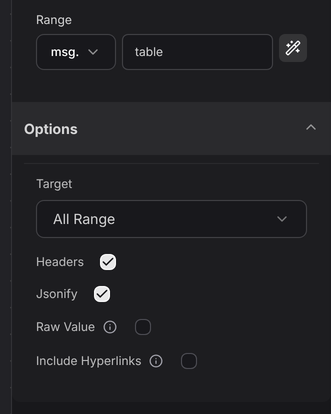
Property Value Excel File Descriptor Message → excel_fdRange Message → tableTarget All RangeHeaders on Jsonify on With Target set to All Range you can leave From Cell and To Cell empty — the node reads the sheet's whole used range in one call. The alternative, working out the last row and last column yourself and building an
A1:F250string, is more work and gets the bounds wrong on a sheet with gaps. -
Add Debug (Programming → Debug) last, with Debug Data set to Message →
table.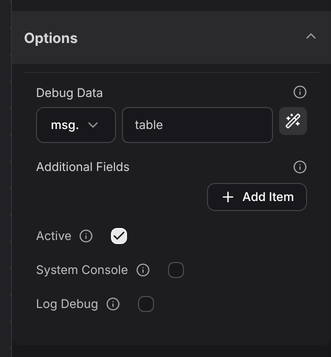
Leaving Debug Data empty dumps the whole message, which is also useful — but pointing it at one variable keeps the panel readable when the message has grown.
-
Save and run.
What you get back
Open the Debug panel and you will see this shape:
msg.table = {
  "columns": ["name", "age", "location"],
  "rows": [
    { "name": "John", "age": 54, "location": "Boston" },
    { "name": "Jane", "age": 47, "location": "London" }
  ]
}
That is Robomotion's data table — plain JSON, not a special
object. columns is an array of strings; rows is an array of objects, one key per column.
The two options you turned on decide what the column names are:
| Headers | Jsonify | columns |
|---|---|---|
| off | — | ["A", "B", "C"] — spreadsheet letters |
| on | off | The first row, verbatim: ["Price Range"] |
| on | on | Lowercased, spaces underscored: ["price_range"] |
Leave Jsonify on. msg.row.price_range is pleasant to type; msg.row["Price Range"] is
not, and one stray capital in the spreadsheet breaks it.
Walking the rows
Feed msg.table.rows to the ForEach from tutorial 4 and each
pass gives you one row object in the message. That is the whole pattern behind most
spreadsheet automation: read once, loop, do something per row.
A Function node can do anything to this JSON that JavaScript can. When that starts getting tedious, install the DataTable package — it has nodes for sorting, removing duplicates, replacing values, merging two tables and querying, plus converters that build a table straight from CSV, JSON, HTML or PDF.
Try changing it
- Set Target to
Specific Rangeand read onlyA1:C10. - Turn Headers off and run again. Watch the column names become
A,B,C— and watch the first row of your data stop being a header and become data. - Add a Save Excel and Close Excel node. Whatever you open, close.
Next
Automating a browser → — the last core skill, and the one most RPA work actually needs.