Dashboard
The workspace at a glance: what is licensed, what is running, what ran, and what is about to.
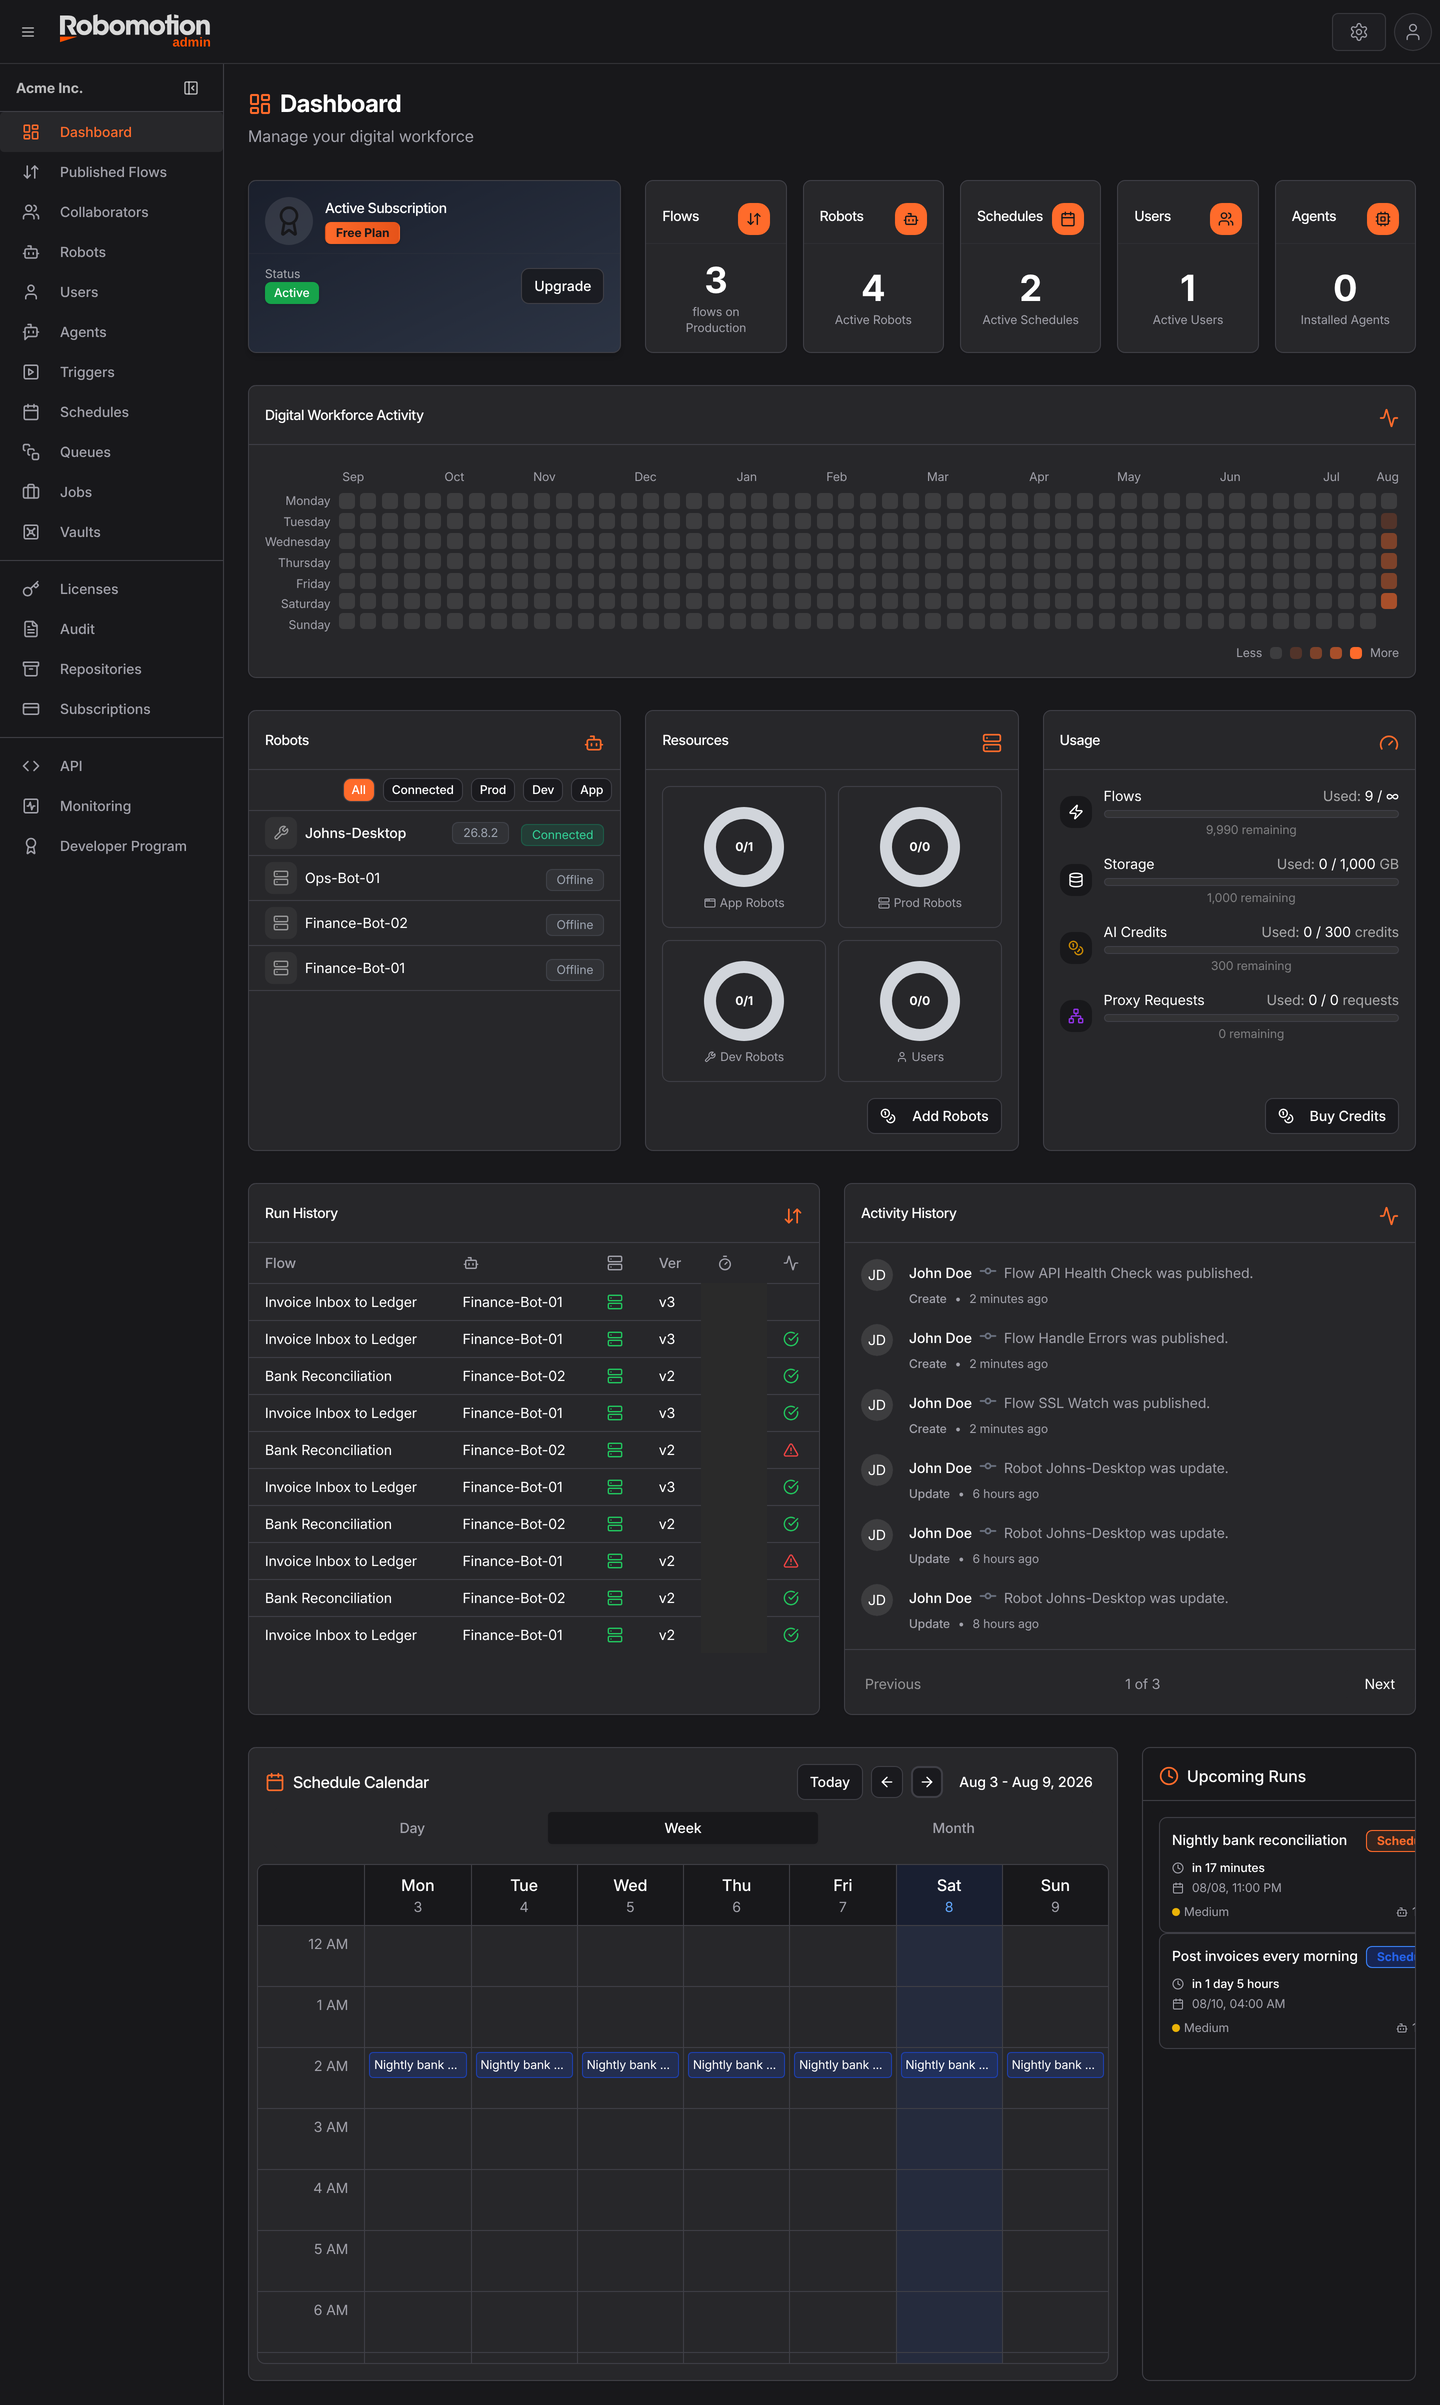
Top row
Your subscription, then five counters. Each card is a link to the page behind it.
| Card | Counts |
|---|---|
| Flows | Flows on production — i.e. published |
| Robots | Active robots |
| Schedules | Active schedules |
| Users | Active users |
| Agents | Installed agents |
Digital Workforce Activity
A year of run activity as a heatmap, weekday by month. Its value is the shape rather than the numbers: a column that goes quiet is a schedule that stopped firing, and that is easier to spot here than in a job list.
Robots, Resources and Usage
Robots lists your robots with their connection state, filtered by All / Connected / Prod / Dev / App. Connected robots show the version they are running, which is the quickest way to find one that needs updating.
Resources shows robot slots as used-over-licensed — app, production, development — so you can see at a glance whether you have headroom or need another licence.
Usage tracks consumption against the plan: flows, storage, AI credits and proxy requests, each with what remains.
Resources counts robot slots, which come from licences or your subscription. Usage counts consumption. Running out of either stops work, and they are refilled in different places.
Run History and Activity History
Run History is the last runs — flow, robot, version, and whether each succeeded. It is the short version of Jobs.
Activity History is who changed what: flows published, robots updated, schedules created. The full record, searchable and exportable, is in Audit.
Schedule Calendar and Upcoming Runs
The calendar lays scheduled runs out by day, week or month — which is how you catch two heavy jobs booked against the same robot at the same time, a thing a list of cron expressions hides.
Upcoming Runs is the next few, counted down: "in 17 minutes", "in 1 day 5 hours". Worth a glance before taking a robot offline.