Debugging
The message object is passed from node to node and changes as it goes. Debugging a flow is mostly a matter of answering one question: what is in the message at this point?
The Debug node answers it. Drop one anywhere in a flow and it prints the message as it passes through.
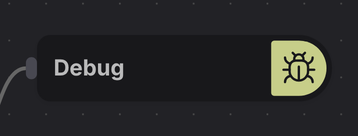
It is in the Programming section of the palette, and it has an input but no output — it is a probe you hang off a branch, not a step in the chain.
Where to put one
After the node whose output you are unsure about. Here is the JSON Minifier template: a Function node builds a value, and the Debug node immediately after it shows what that value turned out to be.
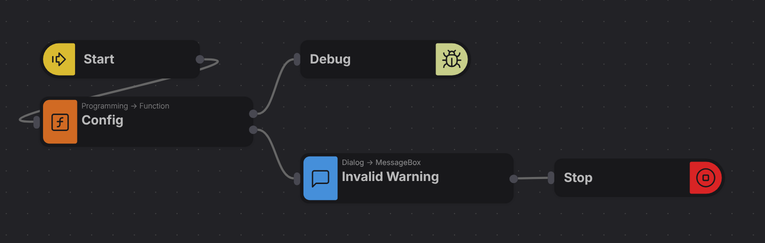
That is the whole technique. When a flow misbehaves, put a Debug after the last node you trust and another after the first node you suspect, and the gap between them is where the problem is.
Printing one field instead of everything
By the time a message has been through half a dozen nodes it can be large, and a full dump is harder to read than no dump. Select the Debug node and set Debug Data to the single field you care about:
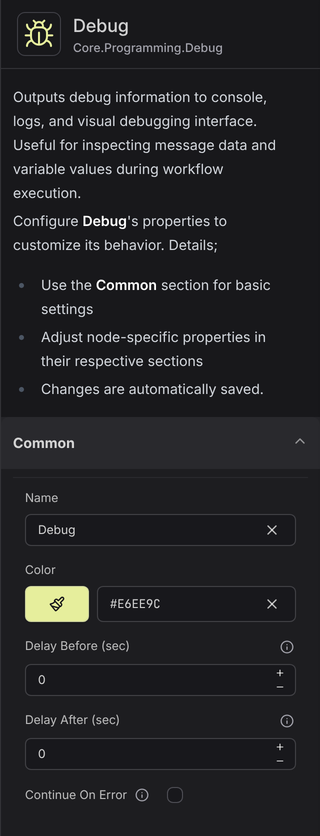
| Property | Effect |
|---|---|
| Debug Data | Which part of the message to print. Leave it on the whole message, or point it at one field |
| Active | Turn the probe off without deleting it — useful before publishing |
| System Console | Also write to the robot's own console, not just the Designer |
Active is worth knowing about. A Debug node left switched on in a published flow keeps printing on every run; switching it off leaves the node in place for next time.
Where the output appears
Debug output goes to the Dev Console, which you open with the bug icon in the top right of the canvas. It has three tabs — Events, Debug and Agents — and each carries a count, so you can see at a glance whether anything arrived.
The Debug tab fills as the flow runs on a connected robot. For a flow that has already run — scheduled, triggered, or run by someone else — the same information is in Admin Console → Jobs, which keeps each run's logs.
Nodes colour themselves as the robot reaches them, so you can watch execution move across the canvas. If it stops at a node, that node is where to look — often before you need a Debug node at all.
See also
- Message Object — what you are actually inspecting
- Exceptions — when the problem is an error rather than a wrong value
- Jobs — logs for runs that already happened